

Customer value becomes predictable after 90 days, not after the first order
About this series. Which customers are worth paying for? We are working through customer lifetime value on two years of real order history from a UK online retailer (UCI Online Retail II, an open dataset). Part 1 showed that the first order identifies only a minority of the customers who end up mattering. This is part 2: how long you have to wait before that changes.
If the first order is a poor guide to a customer's value — and in part 1 it was — the practical question is not whether to predict lifetime value but when. Wait too long and the budget decision has already been made. Act too early and you are ranking customers on noise. So we measured it.
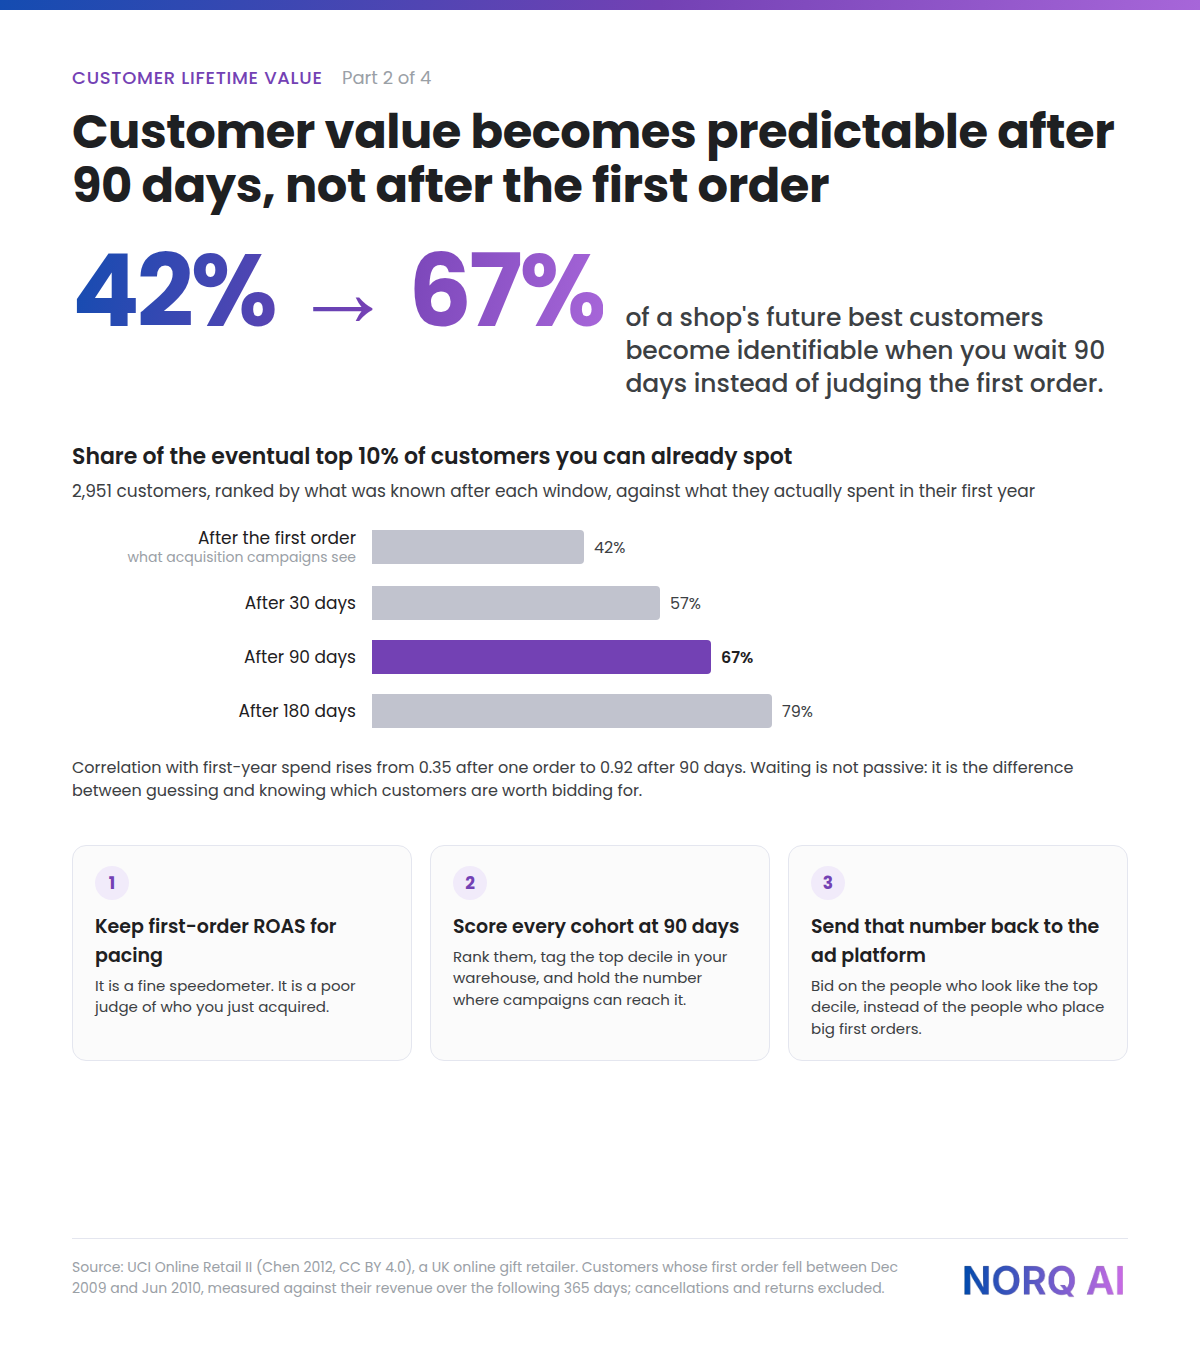
42%of the eventual top 10% are identifiable from the first order alone
67%after 90 days of order history
0.35 → 0.92correlation with first-year spend, first order vs. 90 days
The measurement
We took every customer whose first order fell in the first seven months of the data (December 2009 to June 2010), so that each has a full year of history afterwards — 2,951 customers. Their outcome is what they spent in the 365 days from their first order. Then, for four observation windows, we ranked customers by what a retailer would have known at that point and asked: take the top 10% of that ranking; what share of the customers who actually ended up in the top 10% does it contain?
| What you know after… | Share of the eventual top 10% identified | Correlation with first-year spend |
|---|---|---|
| The first order | 42% | 0.35 |
| 30 days | 57% | 0.81 |
| 90 days | 67% | 0.92 |
| 180 days | 79% | 0.95 |
The shape matters more than any single row. Between the first order and 30 days the correlation more than doubles, from 0.35 to 0.81 — that jump is simply the information that the customer came back at all. By 90 days it reaches 0.92, and the next three months add 0.03. Ninety days is where the curve flattens: the point at which waiting longer stops buying much accuracy and starts costing real budget.
One honest caveat on what the 42% means. It is not a model, it is a ranking on observed revenue; a proper prediction using frequency, recency and order value would do better, and that is a later part of this series. What the table establishes is the information available at each point, which is the ceiling any model is working under.
Why the first order tells you so little
A single order is one draw from a customer's behaviour, and it is dominated by what they happened to need that day. It contains no information about the thing that actually drives lifetime value: whether they come back. A customer who spends £40 three times in ninety days is worth far more than one who spends £300 once, and only the first ninety days can tell them apart.
This also explains a pattern most retailers will recognise: campaigns optimised on first-order value tend to find customers who place large one-off orders. That is not a failure of the algorithm. It is the algorithm doing exactly what it was told.
What this means for your shop
Under the hood — for the technically curious
One query on the order-grain fact built in part 1. The windows are computed relative to each customer's own first order, not to a calendar date:
WITH cohort AS (
  SELECT customer_id, MIN(order_date) AS first_date
  FROM fct_uci_orders
  WHERE customer_id IS NOT NULL
  GROUP BY 1
  HAVING first_date BETWEEN '2009-12-01' AND '2010-06-30'
),
windows AS (
  SELECT c.customer_id,
    SUM(IF(o.order_date = c.first_date, o.revenue_gbp, 0))                          AS rev_first_order,
    SUM(IF(DATE_DIFF(o.order_date, c.first_date, DAY) <  90, o.revenue_gbp, 0))     AS rev_90d,
    SUM(IF(DATE_DIFF(o.order_date, c.first_date, DAY) < 365, o.revenue_gbp, 0))     AS value_365d
  FROM cohort c JOIN fct_uci_orders o USING (customer_id)
  GROUP BY 1
),
ranked AS (
  SELECT *,
    PERCENT_RANK() OVER (ORDER BY value_365d DESC)      < 0.1 AS is_top,
    PERCENT_RANK() OVER (ORDER BY rev_first_order DESC) < 0.1 AS top_by_first_order,
    PERCENT_RANK() OVER (ORDER BY rev_90d DESC)         < 0.1 AS top_by_90d
  FROM windows
)
SELECT
  ROUND(COUNTIF(is_top AND top_by_first_order) / COUNTIF(is_top) * 100) AS pct_caught_first_order,
  ROUND(COUNTIF(is_top AND top_by_90d)         / COUNTIF(is_top) * 100) AS pct_caught_90d
FROM ranked
A note on comparing with part 1, which reported one in three rather than 42%: that measurement covered all 5,852 identified customers against a two-year outcome, this one a 2,951-customer cohort against a one-year outcome. Different population, different horizon, same direction. Whenever a number in this series changes, the definition changed with it, and we say so.
Data and licence
Chen, D. (2012). Online Retail II [Dataset]. UCI Machine Learning Repository, doi:10.24432/C5CG6D, licensed CC BY 4.0. A UK-based, non-store online retailer of unique all-occasion giftware, December 2009 to December 2011; many customers are wholesalers, so concentration is at the sharp end of what a consumer shop would see. Cancellations, returns and non-product lines are excluded.
Next in the series: teaching Google Ads what a good customer is — value-based bidding on predicted lifetime value, and the export that makes it possible. Related: A recommendation engine written in 30 lines of SQL beat the bestseller list by 60%, part 2 of our recommendation-systems series.
Start Your Data Transformation Journey
Discover practical, scalable solutions tailored to your business priorities.