

A recommendation engine written in 30 lines of SQL beat the bestseller list by 60%
About this series. We are building a recommendation engine from scratch on Google's own store data — the public GA4 export of the Google Merchandise Store — and publishing what comes out, including what does not work. Part 1 built the data foundation and found the traps inside it. This is part 2: the simplest models that work, and how far they get.
With a clean interaction table in place, the obvious next question is what to put in it. Not the most sophisticated model — the simplest one that beats doing nothing. We put five candidates against each other on the same data, under the same test, and the winner is a single SQL query with no training step at all.
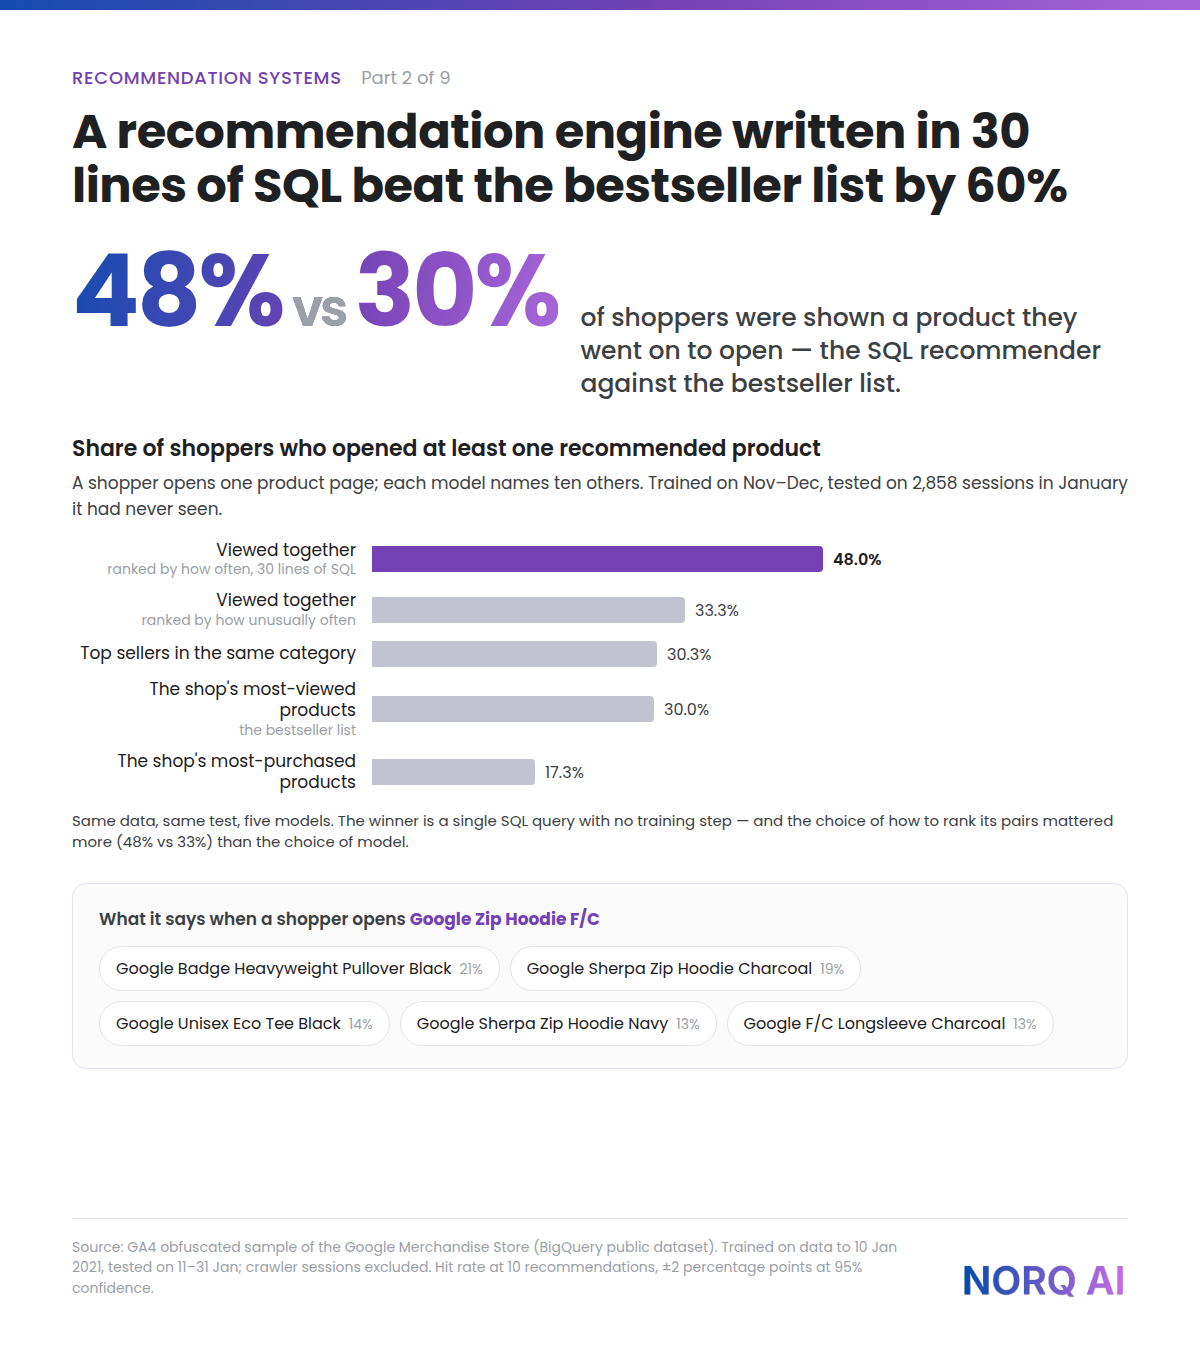
48.0%of shoppers were shown a product they went on to open — co-occurrence in SQL
30.0%the same measure for the shop's bestseller list
2,858held-out January sessions, never seen in training
The test
Models learned from 1 November to 10 January and were scored on sessions from 11 to 31 January that they had never seen. Within each test session we take the first product the shopper opened as the input, and the products they opened afterwards as the target. The headline metric is a hit rate: in what share of sessions did the ten recommendations contain at least one product the shopper actually went on to open? Crawler sessions — part 1 explains why they matter — are excluded throughout.
The results
| Model | Hit rate at 10 | Precision at 10 | Products it ever recommends |
|---|---|---|---|
| Viewed together, ranked by how often | 48.0% | 7.3% | 315 |
| Viewed together, ranked by how unusually often (lift) | 33.3% | 4.5% | 367 |
| Top sellers in the same category | 30.3% | 4.5% | 107 |
| The shop's most-viewed products (the bestseller list) | 30.0% | 3.9% | 10 |
| The shop's most-purchased products | 17.3% | 2.2% | 10 |
Absolute hit rates in this range are normal for e-commerce and are not the interesting part. The comparisons are. Three of them are worth a retailer's attention.
1. How you rank the pairs matters more than which model you pick
The same co-occurrence model scored 48.0% and 33.3% depending only on how its product pairs were ordered. Ranked by confidence — of the sessions that viewed A, what share also viewed B — it wins comfortably. Ranked by lift — how much more often than chance A and B appear together — it loses fifteen points.
Lift is the textbook choice and it reads better in a slide, because it surfaces surprising pairings rather than obvious ones. That is exactly its problem: it rewards rare products, whose co-occurrence counts are small and noisy. The boring ranking is the one that makes money. This is the kind of decision that lives three levels inside a vendor's product and is never in the sales deck.
2. The most-purchased list came last
Purchases are the outcome a shop cares about, so it is tempting to train only on them. In this data that produced the worst model of the five, at 17.3%.
The reason is arithmetic. In the training window there were about 3,500 customers who bought something and about 44,000 who browsed. Purchase data gave enough co-occurrence support for 79 of the 384 products; view data covered 286. And on a product page the shopper in front of you has usually never bought anything at all — 95% of visitors in this dataset never did — so a model that only understands buyers has nothing to say to most of the people it is asked about.
The practical shape is to learn from views and measure against purchases, weighting the stronger signals more: a view counts for something, a cart for more, a purchase for most.
3. The bestseller list is not inaccurate, it is blind
At 30.0% the bestseller list is a respectable predictor — popular products are popular for a reason. But it recommends ten products out of four hundred, the same ten to everyone, so 97% of the catalogue has no route to a customer who was not already looking for it. The co-occurrence model surfaced 315 different products across the same sessions. Any shop whose margin depends on more than its top ten lines should measure coverage alongside accuracy.
What this means for your shop
Under the hood — for the technically curious
Everything runs in BigQuery against the curated interaction table described in part 1. The winning model, in full:
WITH baskets AS (
  SELECT DISTINCT session_key, item_key
  FROM fct_user_item_interactions
  WHERE interaction_type = 'view'
    AND NOT is_suspected_bot
    AND interaction_date <= '2021-01-10'        -- training window only
),
item_counts AS (SELECT item_key, COUNT(*) AS n FROM baskets GROUP BY 1),
pairs AS (
  SELECT a.item_key AS item_a, b.item_key AS item_b, COUNT(*) AS n_ab
  FROM baskets a JOIN baskets b
    ON a.session_key = b.session_key AND a.item_key != b.item_key
  GROUP BY 1, 2
  HAVING n_ab >= 3                              -- ignore pairs with no support
)
SELECT item_a, item_b,
  n_ab / ca.n AS confidence                      -- P(viewed b | viewed a)
FROM pairs
JOIN item_counts ca ON ca.item_key = pairs.item_a
QUALIFY ROW_NUMBER() OVER (PARTITION BY item_a ORDER BY confidence DESC, n_ab DESC) <= 10
That is the whole engine. The evaluation harness around it is longer than the model: it
builds the test cases from held-out sessions, asks each model for ten products, removes
the input product from every list, and counts hits. Swapping confidence for
(n_ab / ca.n) / (cb.n / total_sessions) gives the lift ranking that scored
fifteen points worse.
The same query run on interaction_type = 'purchase' produces a perfectly
reasonable "frequently bought together" for the cart page. Different placement, different
signal, same thirty lines.
Data and licence
bigquery-public-data.ga4_obfuscated_sample_ecommerce — the obfuscated GA4
export of the Google Merchandise Store, 1 November 2020 to 31 January 2021, published by
Google through the Cloud Public Datasets Program. Hit rates carry roughly ±2
percentage points at 95% confidence on 2,858 test sessions, so the gaps between the top
model, the middle three, and the last one are all well outside noise; the three-way tie in
the middle is not.
Next in the series: what these offline scores cannot tell you, and the ladder from a held-out test to a live holdout group. Related: Customer value becomes predictable after 90 days, part 2 of our customer-lifetime-value series.
Start Your Data Transformation Journey
Discover practical, scalable solutions tailored to your business priorities.